1. Introduction: Getting Carried Away with Our Creations
In software engineering, it’s routinely true that engineers can get carried away building things in a complex way that could be simpler. It’s easy to do — and for creative and inventive people, it’s actually delightful. We love inventing things. It’s like an adventurer who enjoys hacking their way through a jungle. There may be a paved road a few meters to the side, that would let us make much greater progress, but we delight in hacking away at the foliage because it’s what we’re good at.
What should we do in this situation? How can we make sure we make best progress?
2. Recognising the trap
Ingenuity can be a trap. If you are trying to invent something, and a better answer already exists, then you could be wasting your time.
But, let’s be honest, it’s fun. We’re creative people and it feels great to invent things. It makes us feel (and look) smart. The act itself is enjoyable. And so as pleasure-seeking nerds it’s sometimes the easiest path.
What we need are mental tools. Questions which can help us make sure we’re on track. If you’re navigating, every so often you should (1) stop, (2) orient yourself, (3) consult a map.
2.1 First, Stop
So how do we do the first part? When should we stop?
We need to ask ourselves regularly;
Does this feel complicated right now?
This is your signal. You’re writing a bit of code, and it starts to feel like it’s getting a little too complex for your brain. Or maybe it feels like a delightfully chalenging puzzle. Maybe that’s OK, and you need this particular bit of complexity. But maybe not. But the feeling of complexity should be like a yellow traffic light — not a red, but you should probably take your foot off the accelerator for a moment, and hover over the brake.
2.2 Second, Orient Yourself
Now that you’ve paused, perhaps ask this;
Is the complexity mine?
By which I mean — is this complex because your current problem genuinely demands it? Or is it accidentally complex, because you are lacking a simpler way to express the problem?
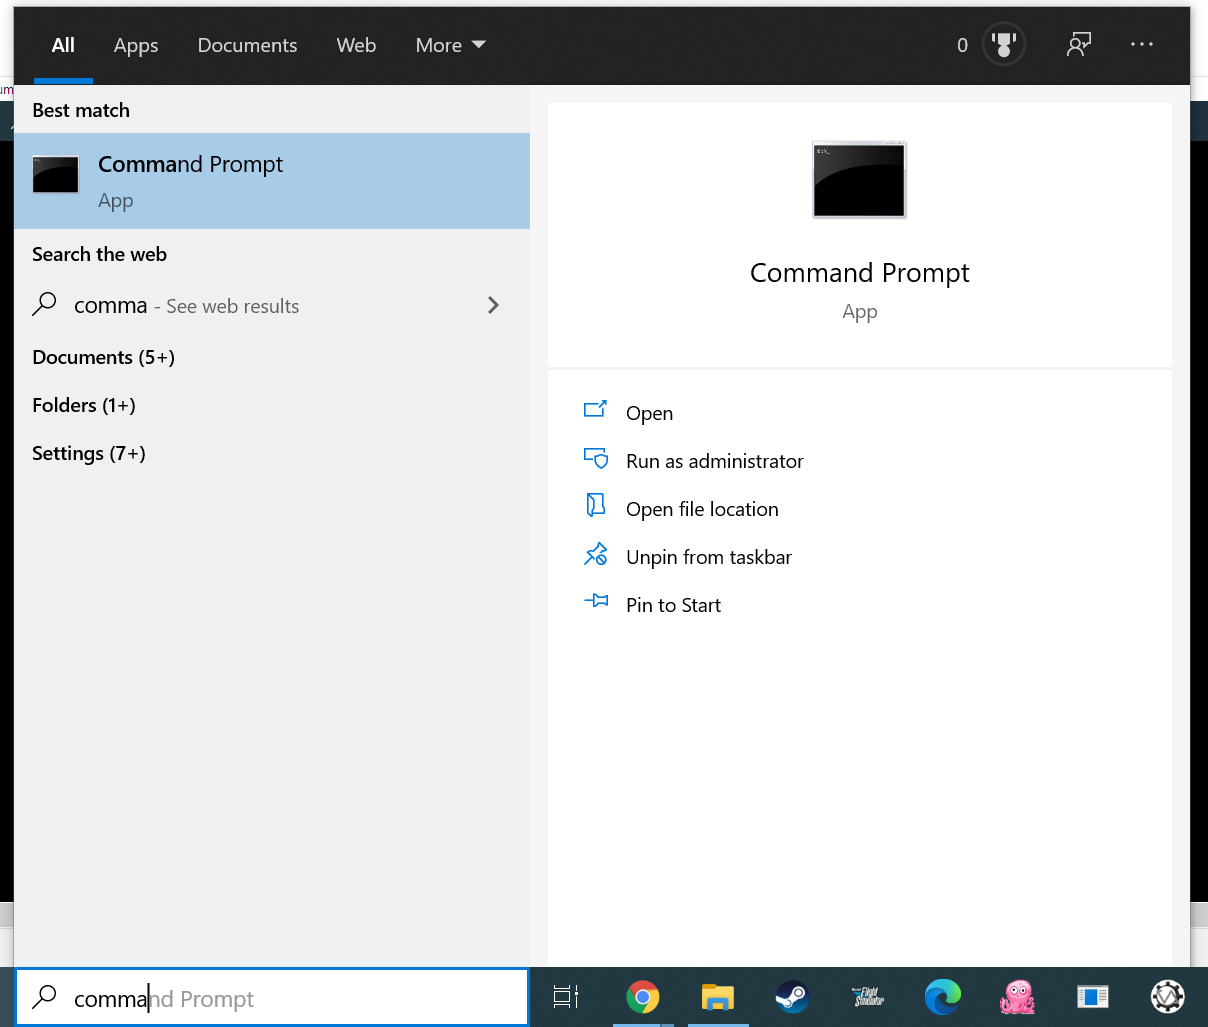
To illustrate, here’s an example. Recently I found myself writing a small app which connected to the serial port of an arduino, and talked to it using a custom protocol. That meant that my program needed to
discovering connected devicessending and receiving bytes along the wiresending requests using the protocolreceiving responses using the protocol
Now, (1) and (2) are ‘someone else’s’ — other people have needed to discover USB devices, and connect to a serial port. I should not spend time here. (3) and (4) are the specifics of my program.
2.3 Third, Consult a Map
So if the complexity isn’t yours, then you need to pump the brakes and ask;
How has this been solved elsewhere?
Note the assumption — it has been solved elsewhere. Because almost always, ten thousand other tems have needed what you need, and the problem has been discovered, studied, optimised, distributed, documented, and commoditised.
Or in other words, you do not need to write an crap event bus.
In the immortal words of Greenspun’s Tenth Law:
Any sufficiently complicated C or Fortran program contains an ad hoc, informally-specified, bug-ridden, slow implementation of half of Common Lisp.
So make sure you’re not making that mistake.
Here are a couple of examples;
Example 1: text search Let’s say you find youself searching for a pattern within some text, and you’re writing code like this;
// extract all the digits at the start of the string
digits = []
for c in string:
if c.is_digit()
digits.push(c)
else
break
Then you might know that you can use regular expressions. Of course you can do it yourself, but a regex might be the way to go. This is probably not your complexity. Note the complexity, note it’s not yours to solve, find another approach.
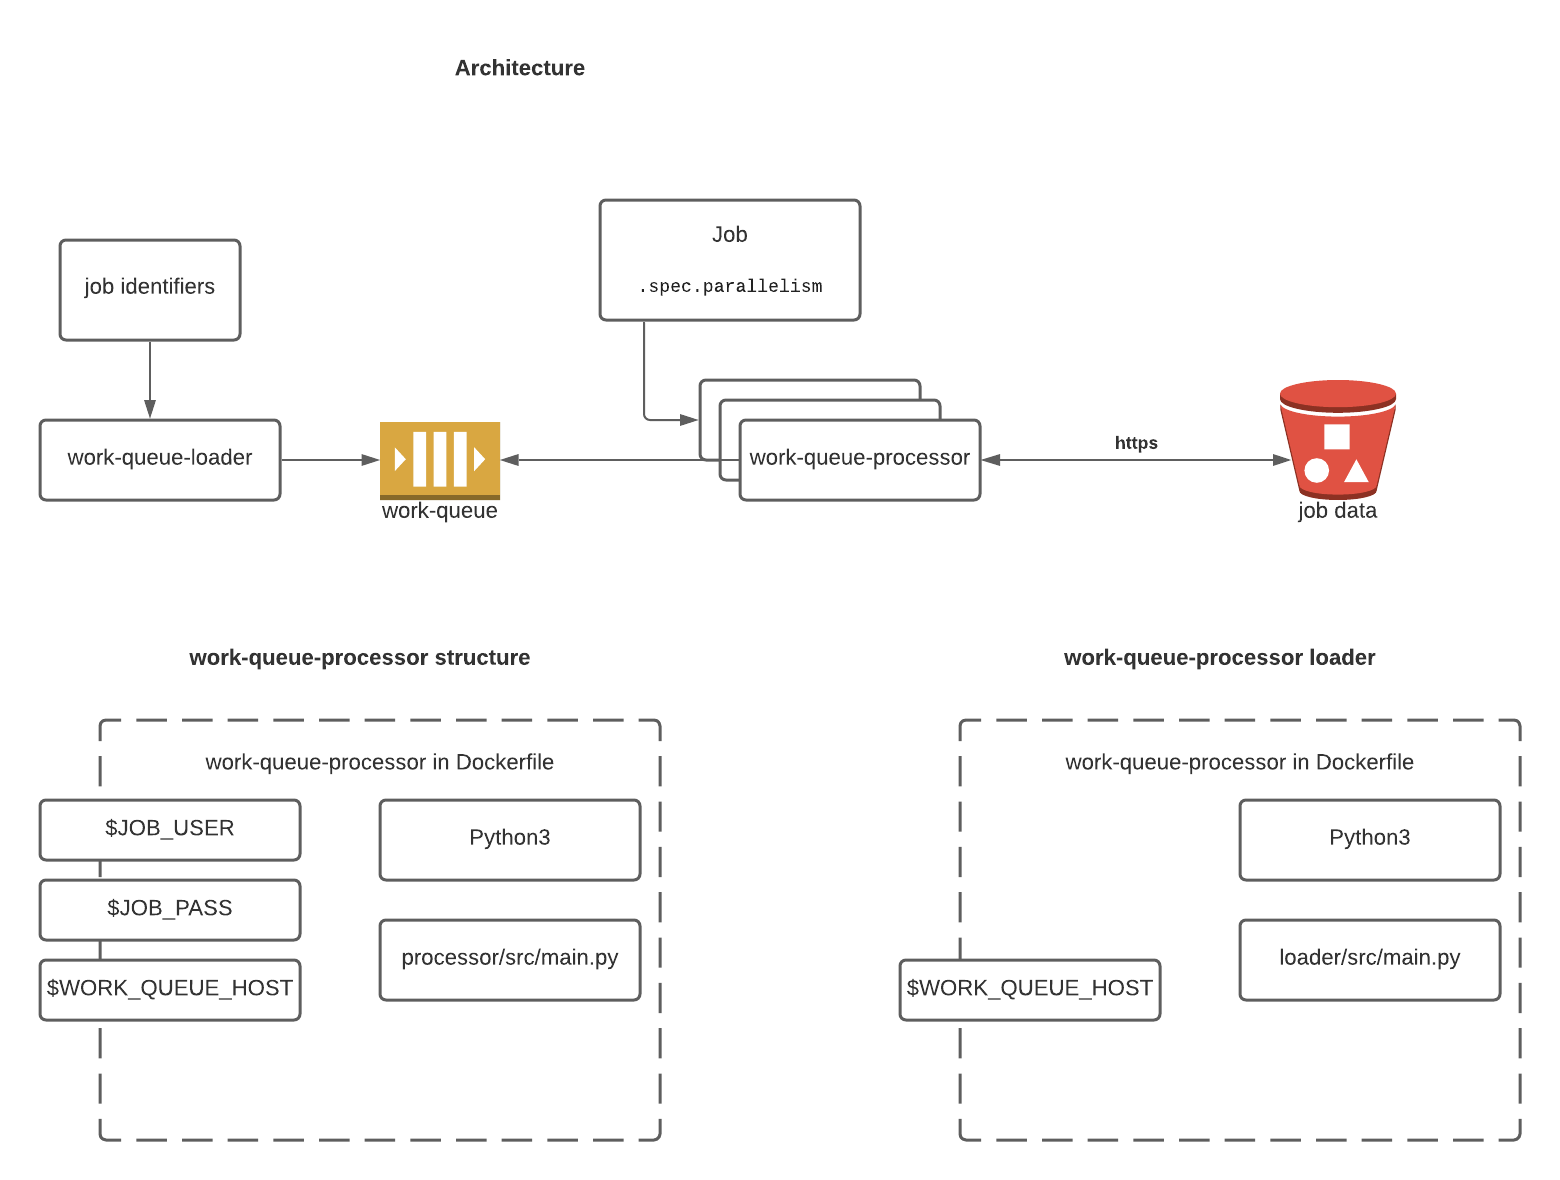
Example 2: parallel tasks. Another example. You’ve written some code to process a big batch of data. And your code currently maxes out one CPU but isn’t using the whole machine. You think you can improve throughput by … something with threads?
At this point, you can probably recognise that you’re not the first person to want to maximise the efficiency of a machine. You’re not the millionth person to want it. And so there will be a solution out there — indeed, many approaches.
Whether you go for threads, async tasks, worker pools, message queues, event busses, map-reduce jobs… this again isn’t your complexity. You should be picking a solution off the menu, not inventing a new recipe
The key takeaway is this;
Someone solved this in 1987 and you forgot a fix existed.
3. Developing as an Engineer
So as a developing engineer, there is a kind of dialog we need to have with ourselves;
This is quite complicated and I feel like I might be getting lost in the weeds. What other system or technique should I be using instead of using raw ingenuity?
And here’s what you should be understanding as you develop.
When you start programming, you rely on raw ingenuity because you know no better. You might write that string search by iterating characters because you’ve never heard of regex. You might try to manage a Vec with a spinloop because you never heard of a Semaphore.
So, developing as an engineer is characterised by building a mental list of the systems or techiques that could be used in any particular situation. More junior engineers need to learn low-level patterns of software. From functions and strings, through objects, through design patterns, etc. You learn about libraries you could use instead of writing your own. You learn about concepts, like regular expressions, that save you from writing complex code.
Senior engineers are those learning about how to structure larger pieces of software, into modules and microservices, and how to build software that is more observable and operable.
Architects learn about cooperating pieces of software such as custom services, message queues, database, etc and how you can avoid writing new software by reusing known enterprise software patterns.
So the career path of an engineer involves becoming aware of other systems, and being confident enough in how they work to be able to substitute them for raw ingenuity.
4. Conclusion
Ultimately, engineering is about delivering value, not flexing creativity for its own sake. Raw ingenuity, while fun and occasionally necessary, can become a detour if you ignore well-worn paths that already solve the problem. Your career progress is really constrained by what you know about existing patterns, tools, and platforms. The real art is in knowing when to pause, observe complexity, and consult the “map” of solutions around you. Recognizing this balance is what separates engineers who merely enjoy invention from those who deliver outstanding, maintainable, and timely results.